
The Role of Diastolic Blood Pressure on Myocardial Heart Patients
Ishita Saha1 and Rabindra Nath Das2*
1Department of Physiology, Calcutta Medical College and Hospital, India
2Department of Statistics, The University of Burdwan, India
*Corresponding author: Rabindra Nath Das, Department of Statistics, The University of Burdwan, Burdwan, West Bengal, India
Article History
Received: February 05, 2022 Accepted: February 09, 2022 Published: February 10, 2022
Citation: Saha I, Das RN. The Role of Diastolic Blood Pressure on Myocardial Heart Patients. Int J. Hert & Vasclr Syst. 2022;2(1):1‒3. DOI: 10.51626/ijhvs.2022.02.00006
Editorial
Generally, hypertension (or equivalently high Blood Pressure (BP)) is directly correlated with ischaemic heart disease and stroke, and it highly affects of the adult individuals [1-3]. Practically cardiac risk factors namely ejection fraction, BP and heart rate are interrelated [3-5]. Generally, high BP is controlled by pharmacotherapy. Generally, many causal factors namely lifestyle, sleep apnoea, family history and some other biochemical factors are correlated with high BP [6,7]. The following hypotheses are investigated in the present report.
• For Acute Myocardial Infarction Patients (AMIPs), how do we determine the associations of Diastolic BP (DBP) with other cardiac factors?
• What are the relationships of DBP with other cardiac factors of AMIPs?
• What are the influences of DBP on the remaining cardiac factors of AMIPs?
The above mentioned hypotheses are surveyed with 500 individuals along with 21 variables, or factors. The data set was the Worcester Heart Attack Study, which had been surveyed by Dr. Robert J. Goldberg, Cardiology Department, The University of Massachusetts Medical School. The subjects population, data recording methods are well illustrated in [8], and the data can be obtained in the site: ftp//ftp.wiley.com/public/sci_tech_med/survival. For immediate application of the 21 study factors, they are reproduced as follows.
• Age of the patient at the time of hospital admission,
• Sex (0=male, 1=female),
• At the time of hospital admission Heart Rate (HR),
• At the time of hospital admission DBP,
• At the time of hospital admission Systolic Blood Pressure (SBP),
• History of Cardiovascular Disease (CVD) (0 = no, 1 = yes),
• Body Mass Index (BMI),
• Atrial Fibrillation (AFB) (0 = no, 1 = yes),
• Congestive Heart Complications (CHC) (0 = no, 1 = yes),
• Fully heart block (AV3) (0 = no, 1 = yes),
• Cardiogenic Shock (CSK) (0 = no, 1 = yes),
• Myocardial Infarction (MI) order (MIO) (0 = first, 1 = recurrent),
• MI Type (MIT) (0= non Q-wave, 1= Q-wave),
• Cohort Year (CYR) (1=1997, 2=1999, 3=2001),
• Date Of Hospital Admission (DHA),
• Leaving Date from Hospital (LDH),
• Last Follow up Date (LFD),
• Hospital Staying Time from Admission to leaving (HSA) (in days),
• Leaving Status from Hospital (LSH) (0=alive, 1= dead),
• Total Treatment Days from Hospital admission to leaving (THL),
• Survival Status at the Time of Leaving Hospital (SLH) (0= alive, 1= dead).
The data set has 7 variables along with 14 attribute factors. The considered hypotheses are tested by probabilistic modeling of DBP on the rest independent factors. It is identified that DBP is a continuous positive non-constant variance and non-normally distributed dependent random variable. It can be modeled using Joint Generalized Linear Models (JGLMs) applying both the lognormal and gamma distributions [9-11], and it is noted that gamma fit gives better outcomes than lognormal fit. So, only the joint gamma fitted outcomes are displayed in (Table 1), the data developed model fit verification plots are displayed in (Figure 1).
(Figure 1a) shows the absolute residuals plot against the DBP predicted values, which is nearly a flat straight line, interpreting that variance is constant with the running means. (Figure 1b) presents the normal probability plot of the mean DBP gamma fitted model in (Table 1), which does not show any lack of fit. Both the plots prove that the gamma fitted DBP model (Table 1) is nearly its true model.
The gamma fitted DBP mean & dispersion models are as follows.
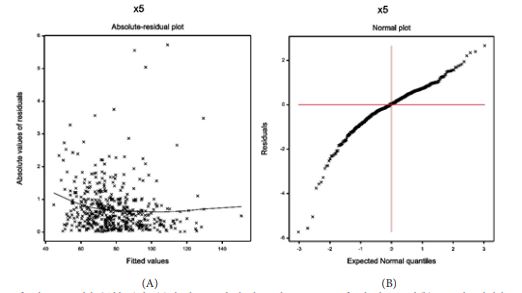
Figure 1: For the gamma fitted DBP models (Table 1) the (a) absolute residuals plot with respect to its fitted values, and (b) normal probability plot for the mean DBP model.
Table 1: Results for mean and dispersion models of DBP from Gamma fit.
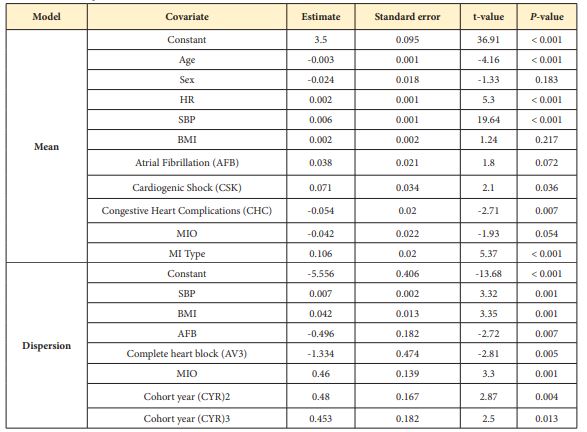
Mean= = exp. (3.500 – 0.024Sex – 0.003Age + 0.002HR + 0.002BMI + 0.006SBP + 0.038AFB – 0.054CHC + 0.071 CSK – 0.042MIO + 0.106MIT),
Dispersion = = exp (-5.556 + 0.007SBP – 0.496AFB – 1.334AV3 + 0.460MIO + 0.042BMI + 0.480CYR2 + 0.453CYR3).
From the above mean & dispersion models of DBP, and Table 1 the following relationships of DBP with the rest cardiac and biological factors can be focused as follows.
• Mean DBP value is inversely related with age (Pr < 0.001), concluding that DBP value is higher for younger than older AMIPs. It is noted that the mean age of the considered subjects is 69.85 years along with the maximum age is 104 years, while the minimum age is 30 years.
• Mean DBP value is partially inversely related with sex (Pr = 0.183), concluding that DBP value is higher for male than female AMIPs.
• Mean DBP value is significantly positively related with HR (Pr < 0.001), implying that it rises as HR increases.
• Mean DBP value is positively related with SBP (Pr < 0.001), implying that DBP value rises as SBP rises, which is commonly observed.
• Mean DBP value is partially positively related with Atrial Fibrillation (AFB) (Pr = 0.072), interpreting that it is higher for AMIPs with AFB than others.
• Mean DBP value is positively related with Cardiogenic Shock (CSK) (Pr = 0.036), implying that it is higher for AMIPs with CSK than others.
• Mean DBP value is significantly inversely related with Congestive Heart Complications (CHC) (Pr = 0.007), concluding that it is higher for AMIPs without CHC than others.
• Mean DBP value is inversely related with MIO (Pr = 0.054), interpreting that it is higher for AMIPs with at first MIO than others.
• Mean DBP value is significantly positively related with MI Type (MIT) (Pr < 0.001), interpreting that DBP value is higher for AMIPs with Q-wave MIT than others.
• Variance of DBP value is positively related with SBP (Pr = 0.001), concluding that its variance increases as SBP rises.
• DBP variance is significantly positively related with BMI (Pr = 0.001), indicating that it increases as BMI rises for AMIPs.
• DBP variance is significantly inversely related with AFB (Pr = 0.007), implying that it is higher for AMIPs with no AFB than others.
• DBP variance of is significantly inversely related with the complete heart block (AV3) (Pr = 0.005), concluding that it is higher for AMIPs with no AV3 than others.
• DBP variance is positively related with the MIO (Pr = 0.001), concluding that it is higher for AMIPs with recurrent MIO than others.
• DBP variance significantly is positively related with the cohort year (CYR) at level 2 (Pr = 0.004) and at level 3(Pr = 0.013), interpreting that it is higher for AMIPs at CYR levels 2 or 3, than 1.
The report has derived many significant relationships of DBP for AMIPs with many cardiac factors such as HR, cardiogenic shock, SBP, atrial fibrillation, MIO, congestive heart complications, MI type, complete heart block, and along with age, sex, BMI, cohort year. It has been shown herein that DBP plays many vital roles in increasing HR, SBP, atrial fibrillation, cardiogenic shock, MI type etc. The role of DBP on some cardiac factors for AMIPs are focused herein. Cardiologists and researchers will be benefited from the report. Special care should be taken on DBP for the AMIPs.
References
- Kearney PM, Whelton M, Reynolds K, Muntner P, Whelton PK, He J (2005) Global burden of hypertension: analysis of worldwide data. Lancet 365(9455): 217-223.
- Micha R, Wallace SK, Mozaffarian D (2010) Red and processed meat consumption and risk of incident coronary heart disease, stroke, and diabetes mellitus: a systematic review and meta-analysis. Circulation 121(21): 2271-2283.
- Menni C (2015) Blood pressure pharmacogenomics: gazing into a misty crystal ball. J Hypertens 33(6): 1142-1143.
- Falaschetti E, Chaudhury M, Mindell J, Poulter N (2009) Continued improvement in hypertension management in England: results from the Health Survey for England 2006. Hypertension 53(3): 480-486.
- Parati G, Ochoa JE, Lombardi C, Bilo G (2013) Assessment and management of blood-pressure variability. Nat Rev Cardiol 10(3): 143-155.
- Stergiou GS, Bliziotis IA (2011) Home blood pressure monitoring in the diagnosis and treatment of hypertension: a systematic review. Am J Hypertens 24(2): 123-34.
- Krivokapich J, Child JS, Walter DO, Garfinkel A (1999) Prognostic value of dobutamine stress echocardiography in predicting cardiac events in patients with known or suspected coronary artery disease. J Am Coll Cardiol 33(3): 708-716.
- Hosmer DW, Lemeshow S, May, S (2008) Applied Survival Analysis: Regression Modeling of Time to Event Data: 2nd Ed. John Wiley and Sons Inc New York.
- Lee Y, Nelder JA, PawitanY (2017) Generalized Linear Models with Random Effects (Unified Analysis via H–likelihood) 2nd Ed. Chapman & Hall, London.
- Das RN, Lee Y (2009) Log-normal versus gamma models for analyzing data from quality-improvement experiments. Quality Engineering 21(1): 79-87.
- Lesperance ML, Park S (2003) GLMs for the analysis of robust designs with dynamic characteristics. Jour Qual Tech 35: 253-263.