
Application of Relational Bayesian Networks to Vector Control in New York City
Waheed I Bajwa*, Mario Merlino
Department of Health and Mental Hygiene, New York, USA
*Corresponding author: Waheed I Bajwa, Department of Health and Mental Hygiene, New York, USA
Article History
Received: October 23, 2021 Accepted: October 30, 2021 Published: November 18, 2021
Citation: Bajwa WI, Merlino M. Application of Relational Bayesian Networks to Vector Control in New York City. Int. Jr. Infect Dis & Epidemlgy. 2021;2(2):45‒48. DOI: 10.51626/ijide.2021.02.00009
Abstract
We propose a novel way of rapidly formulating hypotheses describing the efficacy of West Nile virus (WNV) control campaigns using relational Bayesian Networks (RBN). RBN takes advantage of both quantitative information and expert opinion. We used multiyear, geo-referenced, and temporal data about dead birds, mosquitoes and humans, to infer probable relationships using proprietary software (CleverSet® Modeler) and discover the RBN that best fit the data for our initial models. Additional expert knowledge was later utilized for augmenting subsequent models. The final RBM was created after relating all the variables of interest that correlate to the occurrence of human cases, positive birds, and positive mosquitoes. The findings of this research suggest that WNV positive birds are valuable indicators of WNV activity. The most probable core organisms are bird-feeding Culex and ground-dwelling birds. WNV preventive measures such as public education, source reduction, and larviciding may be supplemented by adult mosquito control by ground spraying. To effectively interrupt the chain of transmission, careful effort must be devoted to ensuring that fewer mosquitoes remain the day after spray.
Keywords: Birds; West nile virus; Mosquito spray; Adulticiding; Relational bayesian networks
Introduction
West Nile virus (WNV) first emerged in North America in New York City in 1999 [1]. Since that time, the area has remained an important focus of WNV transmission. From 1999-2020, there have been 47 fatal human cases of WNV within New York City’s five boroughs [2]. A surveillance and control program in NYC began upon the emergence of the virus in 1999, with mosquito trapping and virus assays conducted throughout the summer [3]. Passive dead bird collection and testing were also carried out. In the order of the sequence, the following integrated mosquito management measures, including extensive public outreach, intensive source reduction, and need-based larviciding were continuously conducted in at-risk areas until transmission risk has been subsidized to minimal [2]. In mid-late summer, ultra-low-volume (ULV) adulticiding (spraying for adult mosquito control) was applied, when warranted [4]. Spray treatment areas were selected based on the ongoing presence of WNV among the captured mosquitoes. We similarly considered successive weeks of increasing mosquito density and noted when the “mosquito counts exceeded 50 per trap-day in the area”. The areas that matched these conditions were designated as virus-activity hot-spots.
Evaluation of mosquito control campaigns for mosquito-borne diseases in big cities presents significant difficulties. The landscape of the area is large, heterogeneous, and unique, which complicates comparisons between treated and untreated areas. In addition, data were often collected separately by different groups. Similarly, analyses of such data often result in distinct domain models (for vectors, disease reservoirs or human cases), and typically aimed at assessing the value of a particular index, such as dead birds, to develop an early warning system [5,6].
Recent developments in relational Bayesian networks (RBN) provide a method to integrate rich, but independent data sets from multiple sources [7-10]. In this analysis, data are associated in time and space using synthetic variables – variables that capture and leverage the underlying relationships among data tables- much like queries in a relational database [11]. RBN is a representation of the structure of the joint probability distribution over the abovementioned variables [10]. We used data collected in New York City from 2001-2003 to construct BRN that infer relationships between birds, mosquitoes, and humans. BRN takes advantage of both quantitative information and expert opinion, and is updated as new information is input. This methodology is suited to mosquito control efforts, and has previously been applied to estimate risk of mosquito-borne disease [10,12]. Current efforts to model the efficacy of treatments are generally lacking, and thus RBN offers a promising remedy.
Material and Methods
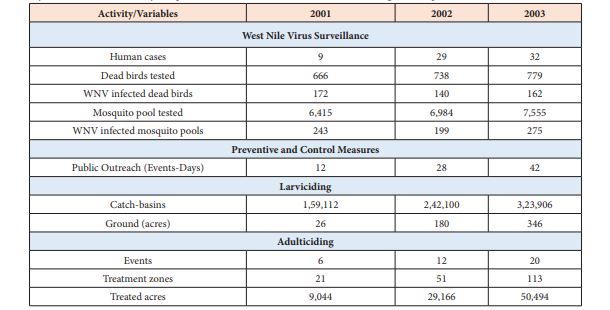
A summary of WNV surveillance results and disease control measures conducted in the 2001-2003 mosquito seasons is given in Table 1. The data used in this study were collected by the Office of Vector Surveillance and Control within the New York City Department of Health and Mental Hygiene. The data contain 70 human cases, 474 WNV positive birds, 717 WNV positive mosquito pools and 158 treatment zones, as well as information about weather and landscape type collected from 2001 through 2003. Since the adulticiding (spraying for adult mosquito control) was carried out as the last resort to target infected mosquitoes, while spray events were used as the reference point in this analysis to evaluate the efficacy of our disease control strategy.
For our RBN analysis, we stored the geo-referenced, time-stamped (date of event or finding) data in tables. The elements of an RBN system are data stored in relational form, whose variables are drawn from the relational data, and machine learning algorithms that fit the model to the data. We restricted our analysis to areas that had been treated for WNV. The observation of West Nile Virus among humans, infected birds, and mosquito-pools in a treated area were amassed in tables. Similarly, relationships to standing water, open space, and tidal areas were captured as table, while information about spray zones was stored as polygons. The WNV positive mosquito and bird reports were described with respect to a virus-activity hot-spot or treatment area and date of spray, and other mosquito management measures listed in Table 1.
Table 1: Summary of West Nile virus activity and preventive and control measures conducted during the mosquito season.
For this modeling effort, the species of mosquitoes and birds were partitioned into the following groups:
Mosquitoes
Bird-feeding Culex: Culex pipiens, Culex restuans, Culex pipiens-restuans
Bridge vectors: Culex salinarius, Aedes vexans, Coquillettidia perturbans, Aedes triseriatus
Recent introduction: Aedes albopictus
Birds
Tree-roosting birds: crows, blue jays, mourning doves
Shrub-roosting birds: American robins
Ground-dwelling birds: sparrows, cardinals
Marsh-roosting birds: grackles
Building-roosting birds: starlings
Since our goal was to observe the impact of adult mosquito control on the probable transmission of the virus, we also build a complementary model of spray zones. The variables in the spray zone model were:
Total birds, positive birds, by group
1-7 days
8-14 days
15-21 days
22-30 days after spray
Total and positive mosquito abundance, by group
day before spray
day after spray
2-7 days
8-14 days
15-21 days
22-30 days after spray
We used proprietary software (CleverSet® Modeler) to discover the relational Bayesian networks that best fit the data for initial model creation, and later “expert knowledge” was incorporated for constructing subsequent models. The initial RBN is not guaranteed to be unique. However, it would serve as a starting point for more rigorous experimental evaluation, particularly when the relationships among these elements are not well known and data are sparse. The final RBM – a spray-zone based model – was created after relating all the variables of interest that correlated to the occurrence of human cases, positive birds, and positive mosquitoes before and after spraying in the treatment zones.
Based on expert knowledge, we constructed variables that resembled database queries describing statements about the relationship among the organisms of interest, spray status, and the environment at specific temporal and spatial resolutions. For example, one variable in the spray zone RBN was the “number of positive bird-feeding Culex in a spray zone the day after the spray”. Another example was a variable describing a bird case from the perspective of human cases such as the “number of ground-dwelling birds that tested positive for West Nile virus found within 2 miles and two weeks prior to a human case.”. However, the statements about landscape did not contain time information, while statements about the weather did not contain spatial information, as these respective variables were taken as uniform across time and space.
Results and Discussion
In our analysis, spatio-temporal models were constructed by dividing time and space into spatio-temporal cells (STCells). The occurrence of human cases, bird cases, and positive mosquito pools was analyzed within the entire set of STCells across time and space. For the human case-based model, only those spatial cells were considered in which at least one human case had occurred and which modeled the occurrence of other human cases and positive birds and positive mosquito pools at specific time intervals. In the spray zone-based model, we considered human cases, bird cases, and positive mosquito pools that occurred in areas that had been treated for larval and adult mosquito control and evaluated for WNV activity prior to and following spray treatment. In the initial analysis, the algorithm was allowed to learn the Bayesian networks, with minimal human supervision (machine learning). The goal of this phase of the evaluation was to verify that it was possible to detect relationships between mosquitoes and birds, humans and birds, and humans and mosquitoes. In the second phase, expert knowledge was applied to search for evidence of core biological relationships, which, if present, would provide evidence of sustained transmission. Lastly, two scales of analysis were evaluated (0.025-degree square by one-week and 0.05-degree square by one-week STCells) to observe whether the observed effects were evident at different spatial scales.
Much like a moving average, the RBN was discovered using variables containing information about spatio-temporal relationships in the data. However, unlike a moving average, the RBN captures the joint probability distribution among the variables described at different spatial and temporal resolutions simultaneously [13]. Linkages among these variables indicates likely relationships among these elements and their most probable spatial and temporal resolutions.
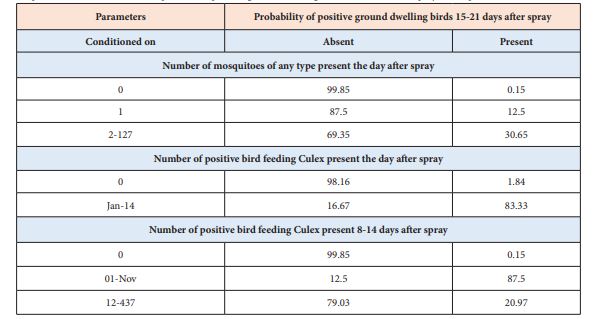
The final model (spray zone RBN) revealed conditional dependencies among ground-dwelling birds in a spray zone two weeks after spray and (1) any mosquitoes the day after spray, (2) positive bird-feeding Culex the day after spray, and (3) bird-feeding Culex the week after spray (Table 2). In the “0.025 degrees by one-week” resolution model, human cases largely correlated with the presence of positive ground-dwelling bird. Positive bird-feeding Culex the day after spray, even in low numbers, was the most predominant indicator for the presence of positive ground-dwelling birds two-weeks after spray (83.33 percent). When the RPM was rerun at the courser resolution of “0.05-degree square by one-week”, the relationships were not as crisp as those in the higher resolution model (0.025-degree by one-week), suggesting that this spatial scale is too large-grained to capture relationships among the core biological organisms involved in the transmission of West Nile virus [14].
Table 2: Conditional probabilities for presence or absence of positive ground-roosting birds 15-21 days after spray conditioned on (1) any mosquitoes the day after spray, (2) positive bird-feeding Culex the day after spray, and (3) bird-feeding Culex the week after spray. Note that low probabilities of mosquitoes remaining after spray (shaded rows) are associated with low probabilities of positive ground roosting three weeks after spray. Positive bird-feeding Culex remaining the day after spray is the most predominant indicator for the presence of positive ground-dwelling birds two-weeks after spray (83.33 percent).
To assess the predictive power of the model, we partitioned the data into a training (80 percent of data) and testing (remaining 20 percent of data) and generated ROC (receiver operating characteristic) curves showing the tradeoff between correct detections of the event of interest (vertical axis) and false alarms (announcements of the event when it has not, in fact, occurred; horizontal axis) (Figure 1). A random model exhibits an ROC extending from the lower left of the graph to the upper right. Here, we notice an abrupt rise of the ROC, which shows that, given the data, the model is highly predictive.
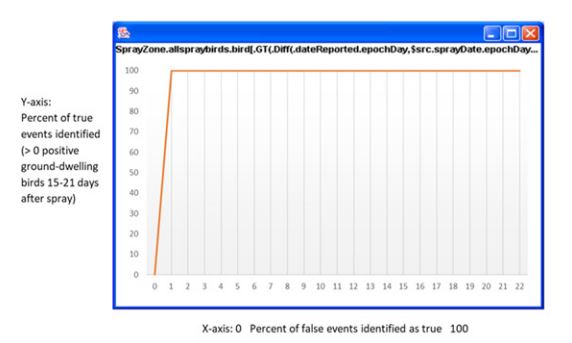
Figure 1: Receiver Operating Characteristic for presence of positive ground-dwelling birds 15-21 days after spray.
This approach provides a “best guess” about complex relationships in an integrative analysis. Since the RBN analyzes the same data from multiple points of view, it can detect subtle, pre-statistical results from data. These results represent a more complex outcome than can be obtained from traditional statistical analyses, and provide insight as to where analytical resources might best be focused for targeted results.
Acknowledgement
The authors are grateful to Dr. Jane Jorgensen, Ex-Principal Scientist at CleverSet®, Inc. and Dr. Philippe Rossignol, Retired Professor of Mathematical Modeling, Wildlife and Fisheries Department, Oregon State University for their assistance with data analysis and improving the contents of this paper.
References
- Ronca S, Ruff J, Murray K (2021) A 20-year historical review of West Nile virus since its initial emergence in North America: Has West Nile virus become a neglected tropical disease? PLOS Neglected Tropical Diseases 15(5): e0009190.
- Bajwa W, Slavinski S, Shah Z, Zhou L, Herbert V (2021) Comprehensive Mosquito Surveillance and Control Plan. New York City Department of Health and Mental Hygiene New York p. 41.
- Bajwa W (2018) A taxonomic checklist and relative abundance of the mosquitoes of New York City. JAMCA 34(2): 138-142.
- Bajwa W, O Connor M, Shah Z, Zhou L (2014) Efficacy of mosquito adulticiding in reducing incidence of West Nile virus in New York City. 2014 NCUE Proceedings 78-82.
- Mostashari F, Kulldorff M, Hartman J, Miller J, Kulasekera V (2003) Dead Bird Clusters as an Early Warning System for West Nile virus Activity. Emerg Infect Dis 9(6).
- Patnaik JL, Juliusson L, Richard LV (2007) Environmental Predictors of Human West Nile virus Infections, Colorado. Emerg Infect Dis 13(11): 1788-1790.
- Orme Zavaleta J, Jorgensen J, D Ambrosio B, Altendorf E, Rossignol P (2006) Discovering Spatio-Temporal Models of the Spread of West Nile virus. Risk Analysis 26(2): 413-422.
- Tamaddoni-Nezhad A, Bohan DA, Raybould A, Muggleton SH (2012) Machine learning a probabilistic network of ecological interactions. International Conference on Inductive Logic Programming. pp. 332-346.
- Getoor L, Taskar B (2007) Introduction to Statistical Relational Learning. MIT Press.
- Ho S H, Speldewinde P, Cook A (2016) A Bayesian belief network for Murray Valley encephalitis virus risk assessment in Western Australia. International Journal of Geography 15(6): 1-19.
- McCann RK, Marcot BG, Ellis R (2006) Bayesian belief networks: applications in ecology and natural resource management. Can J For Res 36(12): 3053-3062.
- Haddawy P, Kasantikul R, AHM Hasan I, Rattanabumrung C, Rungrun P, et al. (2016) Spatialtemporal Bayesian networks for malaria prediction: case study of Northern Thailand. Stud Health Technol Inform 228: 773-777.
- Chavira M, Darwiche A, Jaeger M. 2006. Compiling relational Bayesian networks for exact inference. J Approx Reason 42(1-2): 4-20.
- Barrett ADT (2014) Economic Burden of West Nile Virus in the United States. Am J Trop Med Hyg 90(3): 389-390.