
Prediction of Daily COVID-19 Active Cases in Bangladesh
Shipra Banik1, Mohammad Anwer2 and B M Golam Kibria3*
1Department of Physical Sciences, Independent University, Bangladesh
2Department of Physical Sciences, Independent University, Bangladesh
3Department of Mathematics and Statistics, Florida International University, USA
*Corresponding author: BM Golam Kibria, Department of Mathematics and Statistics, Florida International University, USA
Article History
Received: July 09, 2021 Accepted: July 16, 2021 Published: August 03, 2021
Citation: Banik S, Anwer M, Kibria BMG. Prediction of Daily COVID-19 Active Cases in Bangladesh. Int. Jr. Infect Dis & Epidemlgy. 2021;2(1):25‒33. DOI: 10.51626/ijide.2021.02.00006
Abstract
Recording daily active cases statistics benefits instantly when studying the ongoing COVID-19 dashboard for a country. It would help to illuminate the probable strategy of action for policy makers, as well as planners of a country. The goal of the paper is to forecast daily active COVID-19 cases for Bangladesh using various forecasting models, namely the regression model, the non-linear exponential regression model and some time series models based on the daily positive cases, daily deceased cases, daily recovered cases and some environmentally important variables. Our findings suggest that time series forecasting models have better ability to predict daily active cases as compared to other selected forecasting models.
Keywords: Active cases; COVID-19; prediction; time series modelling; common error measures
Introduction
The worldwide ongoing pandemic of the novel corona virus disease 2019 (COVID-19) is a contagious disease triggered by the severe acute respiratory syndrome coronavirus 2, namely SARS-CoV-2. The first recognized case was from the wet market of Wuhan (a city of China) in December 2019. Since then, this disease has spread, prominently to a continuing pandemic. In the nearby interaction, the germ blowout among people over a small drop out by sneezing, coughing, talking and not moving long distance through air, the dewdrop drops on the surface. The signs of COVID-19 disease are fever, coughing, trouble breathing, tiredness, shortness of breath, chest pain, chills, fatigue, shaking, body aches, sore throat, headache, congestion of runny nose, loss of smell and/or taste, nausea, diarrhea and others. To stop spreading of this deadly virus, the following number of actions carried out, like wearing face mask, personal hygiene, washing hands often with soap, creating social distancing and others.
In order to prevent the spread of the virus, many countries impose shutdown and lockdown. As of June 2021, 181,680,392 cases have been identified in 188 countries and territories, resulting in 3,935,392 deaths (Source: Wikipedia). In March 2020, this deadly disease was first observed to have a blowout in Bangladesh. The first 3 identified instances were stated on March 8 2020, by the Institute of Epidemiology, Disease, Control and Research (IEDCR) . Subsequently, the pandemic has been blowing out gradually over the country. Still, the number of positive cases is growing day by day. From March 23 to May 30 to shelter nationals, this country’s republic government affirmed lockdown all over the country. This time, the government of Bangladesh arranged a few essential footsteps, such as reporting daily newspapers, social media and isolation centers at different hospitals in all districts. To control COVID-19 pandemic in Bangladesh, a series of hotline numbers, email address and Facebook page of IEDCR are also given for nationals to interact if one is suspicious about this virus contagion. With this, it is observed that up to the end of March 2020, contaminations persisted low. However, there was a sharp surge that was noticed in the first week of April 2020. In the mid-month of April, positive cases percentage significantly raised, the highest in Asia after Indonesia. On May 6, 2o2o, the positive cases were confirmed in all districts. Just a note, on June 13, 2020 the number of positive cases in Bangladesh surpassed the number of positive cases in China. Bangladesh touched two edge marks of 160000 active cases and 2000 deaths on 5 July, 2020 and 2 days later passed France in terms of the number of new cases. It is observed that on 12 July, 2020, the number of recoveries exceeded the number of active cases, a positive sign for this country. It is notice that Bangladesh was the second most-infected country in South Asia after the first infected country, India. According to the world health organization report, as of June 27, 2021, in Bangladesh, 888,406 cases have been identified. The number of fatalities due to COVID-19 pandemic is 14,172 till date (Source: Wikipedia).
This paper proposes projecting a model for fitting COVID-19 data in Bangladesh to evaluate, prediction and abstract significant evidence that advantages policy makers, researchers, health workers and others. It is believable that daily active cases play a very important role to understand the current scenario of this virus existing condition of the country. Thus, our goal is to predict daily active cases (people affected by this disease are taken into account) based on daily positive cases, daily decreased cases, daily recovered cases and also on some environmental factors such as daily temperature and daily humidity to find a trend the next day’s trend in the active cases in Bangladesh. A number of works have been done in literature to study daily active cases. To mention a few: Barria-Sandoval [1], Mahanty et al. [2], Sarkar [3], Puttahonnappa et al. [4], Viswanath [5], Rath et al. [6], Hassan et al. [7] among others. To the best of our knowledge in respect of Bangladesh, no work on prediction of active cases is available in the literature. We thought this was of significance because it would advantage us to explain the possible strategies of exploiting it as well as formulate it. To project the trend of daily active cases, we have used various statistical prediction models, including time series of models since our all considered data sets are time series data. The rest of the paper is organized as follows: A brief description of the considered data sets and descriptive measures are given in section 2. Various prediction models are described in the section 3. Results with discussion are presented in section 4. Finally, some concluding remarks are provided in the final section.
Data Descriptions
The COVID-19 data for Bangladesh (from March 8, 2020 to March 29, 2021) were collected from the IEDCR for the daily positive cases, daily deaths, daily recovered cases and daily active cases. To see the virus effects on the Bangladesh environment, daily temperature and daily humidity are also considered (Source: www.noaa.gov). We have used the following formula to calculate daily humidity,
To see the impact of daily cases in Bangladesh, daily positive cases, daily deaths, daily recovered cases and daily active cases are plotted against time (day) in the Figure 1 How Bangladeshi people are affecting and recovering w.r.t day, cumulative frequency for each of the considered COVID-19 data sets are plotted in the Figure 2 The summary statistics of the data are given in Table 1.
It is observed from Figure 1 that the BD positive cases sharply increased up to June 19 2020, then there was a declining pattern up to September 2020. The daily decline was also observed for new cases up to January 2021. This is due to the strict lockdown enforced by the Bangladesh government in almost every sector. Again, a daily rise in new cases was observed at the end of March 2021. It happened again after the lockdown due to the lack of consensus of people, the COVID-19 virus has started to increase up. It is noticeable from this Figure 1 that, like daily infected cases, there were almost similar rising and declining patterns observed in daily active cases. Overall plot of daily active cases under our study periods obviously shows a positive scratch for our country because of a declining pattern w.r.t day by day. It gives us an indication the Bangladeshi Government was working hard to recover COVID-19 infected patients. That reflects in the time plot of the daily recovered cases (See the Figure 1), which is an optimistic bulletin for the Bangladeshi people according to the records of daily recovered cases. The daily number of deaths also plotted in the Figure 1 to understand this variable movement w.r.t each day. If we closely notice this plot, the daily rise observed up to the mid-June, 2020. The cause behind this may be that at the beginning of March 2020, the laboratory test was done in a small number of population. It is ensuing that small number of contagion, which increases gradually the number of deaths. After this period, the lab test numbers were increased and also owing to lockdown, we note that the actual number of death statistics came down slowly up to the mid-November. Unexpectedly, then we observe an increasing trend up to the mid-December, which may indicate to us that the population who was identified with COVID positive earlier was likely to die. After this period, the figure of deaths was slowly down up to the mid-March, 2021 because of conciseness of the population. It is noted that at the end of March 2021, daily deaths have risen so far in our considered end of data periods. Hence, increasing daily deaths through this period could mean COVID contamination was deadly. Overall it may be concluded from these plots that there might be a relation between daily active cases with other considered important COVID-19 daily cases. To get an idea about the cumulative number of positive cases, cumulative number of deaths and cumulative number of recovered cases, see the Figure 2.
Since the focus of this paper is to predict daily active cases, it is important to see whether active cases are related to our considered independent variables or not. To observe this, coefficient of correlation values are reported in Table 2. It appears from Table 2 is that our dependent variable, daily active cases are dependent on other considered independent variables. So it is reasonable to apply some modeling tools to assess the comparative influence of active cases due to our daily considered cases. Thus, our next target is to apply some statistical prediction models to forecast daily active cases.
Statistical Methodology
In this section, we will discuss about some statistical prediction models used to predict daily active cases.
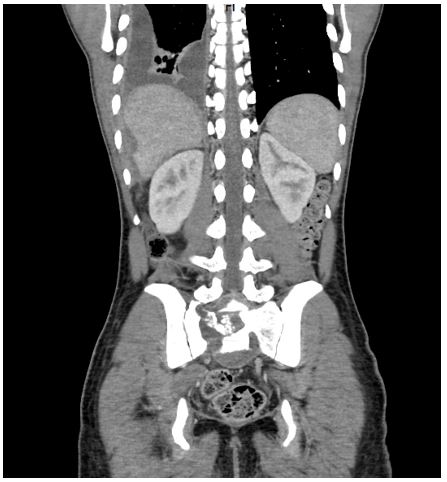
Figure 1: CT scan showing a destructive process centered on S1, with extensive lysis of the right hemi-sacrum.
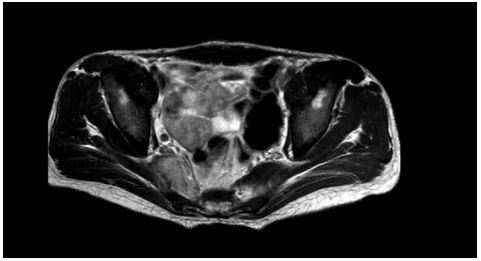
Figure 2: MRI (T1-weighted) showing a large exophytic mass with aggressive bony destruction of S1.
Data Analysis
In this paper, MATLAB 2018 Programming languages are used for all computations. For a sample of MATLAB program, see Appendix.
Fitted models
In this section, we will analyze the data and discuss the outcomes of our study based on various considered forecasting models graphically and numerically. The regression analyses for model (1) are presented in Table 3.
Some Concluding Remarks
In judging the COVID-19 circumstances, daily active cases perform to afford a more precise image to recognize the present pandemic disaster. This paper predicts daily active cases for Bangladesh based on some important independent variables such as daily positive cases, daily deaths, daily recovered cases and also some related environmental variables such as average daily temperature and daily humidity. We have used several statistical prediction models: The linear regression model, the exponential regression model, the auto-regressive exogenous model and the vector autoregressive exogenous model to predict daily active cases based on some important considered independent variables. It is observed that the vector auto-regressive exogenous model predicted daily active cases better compared to other models considered in this paper. We believe the findings of our paper will make an important contribution in the literature of the ongoing deadly COVID-19 pandemic.
References
- Barría-Sandoval C, Ferreira G, Benz-Parra K, López-Flores P (2021) Prediction of confirmed cases of and deaths caused by COVID-19 in Chile through time series techniques: A comparative study. PLoS ONE 16(4): e0245414.
- Mahanty C, Kumar R, Pashra D B K, Hemanth J, Gupta D (2020) Prediction of COVID-19 active cases using exponential and non-linear growth models.
- Sarkar D (2020) COVID 19 Pandemic: A real-time forecasts and prediction of confirmed cases, active cases using the ARIMA model and public health in West Bengal, India.
- Puttahonnappa K, Sharanagouda S S, Prosad P, Gowda S, Hemadri R D, et al. (2021) Prediction of daily and cumulative cases for COVID-19 infection based on reproductive number (R0) in Karnataka: data-driven analytics. Scientific Reports 11(1): 10075.
- Viswanath N C (2020) Prediction of COVID-19 active and total cases after a fall and rise of cases.
- Rath S, Tripathy A, Tripathy A R (2020) Prediction of new active cases of coronavirus disease (COVID-19) pandemic using multiple linear regression model. Diabetes and Metabolic Syndrome 14(5): 1467-1474.
- Hassan R, Dosar A S, Mondol J K, Khan T H, Noman A A, et al. (2020) Prediction of epidemics trend of COVID-19 in Bangladesh. Front. Public Health 8: 559437.
- Al-Dawsari S R, Sultan K S (2021) Modeling of daily confirmed Saudi COVID-19 cases using inverted exponential regression. Math Biosci Eng 18(3): 2303-2330.
- Ahmad W M A W, Aleng N A, Halim N A, Dasril Y, Baharum A (2017) Applied exponential growth regression modeling using SAS: An alternative method of Biostatistics. International Journal of Applied Engineering Research 12(18): 7853-7856.
- Joseph J, Mathew K (2020) Exponential regression via linear modeling using stochastic gradient descent and optimization. International Journal of Science and Research 9(12): 9-11.
- Banik S, Chanchary F H, Rouf R A, Khan A K M (2012) Modeling chaotic behavior of Dhaka stock market index values using the neuro-fuzzy model. Recent Patents on Computer Science 5(1): 72-77.
- Banik S, Silvapulle P (1999) Testing for seasonal stability in unemployment series: International evidence. Empirica 26 (2): 123-139.
- Banik S, Khan A F M, Anwer M (2014) Hybrid machine learning technique for forecasting Dhaka stock market timing decisions. Computational Intelligence and Neuroscience.
- Ashar N D B K, Yusoff Z M, Ismail N, Hairuddin M A (2020) ARX model identification for the real-time temperature process with Matlab-arduino implementation. ICIC Express Letters 14(2): 103-111.
- Haggan-Ozaki V, Ozaki T, Toyoda Y (2006) RBF-ARX modeling for prediction and control. 14th IFAC Symposium on SystemIdentification 39(1): 1210-1215.
- Mechaqrane A, Zouak M (2004) A comparison of linear and neural network ARX models applied to a prediction of the indoor temperature of a building. Neural Computing & Applications 13(1): 32-37.
- Septiani A, Sumertajaya M, Aidi M N (2019) Vector autoregressive X (VARX) modeling for Indonesian macroeconomic indicators and handling different time variations with cubic spline interpolation. Engineering and Technology 6(1).
- Warsano, Russel E, Widiarti W, Usman M (2019) Vector autoregressive with exogenous variable model and its application in modeling and forecasting energy data: Case study of PTBA and HRUM energy. International Journal of Energy Economics and Policy 9(2): 390-398.
- Tuttle J F, Landen D, Klas B, Powell K M (2021) A systematic comparison of machine learning methods for modeling of dynamic processes applied to combustion emission rate modeling. Applied Energy 292: 116886.