
Numerical Flow Disturbance Testing of the Innovative Ultrasonic Flow Meter
Tomáš Vít1*, Jan Novosád2, Petra Dančová3
Faculty of Mechanical Engineering, Institute of Machinery and Informatics, Szent István University, Hungary
*Corresponding author: Tomáš Vít, Department of Power Engineering Equipment, Faculty of Mechanical Engineering, Technical University of Liberec, 461 17 Liberec, Czech Republic
Article History
Received: December 13, 2020 Accepted: January 04, 2021 Published: January 06, 2021
Citation: Vít T, Novosád J, Dančová P. Numerical Flow Disturbance Testing of the Innovative Ultrasonic Flow Meter. Int J. Eng Tech & Inf. 2021;2(1):01‒03. DOI: 10.51626/ijeti.2021.02.00003
Abstract
Ultrasonic flow meters are devices for fluid flow measurement using the ultrasonic principle. Within the technical requirements for gas meters, the flow disturbance test is required. The aim of this study was the CFD analysis of the fluid flow field inside the ultrasonic gas meter regarding the influence of flow disturbance. The methodology for numerical analysis and results assessment was defined. The velocity profiles in the area for ultrasonic measurement have been obtained. The evaluation of the profiles was aimed to confirm that the velocity field (profile) is flow independent. Furthermore, it was necessary to prove insensitivity to input disturbance. The obtained results lead to the statement that the velocity profiles can be considered invariant when the flow rate changes and the disturbance do not affect the velocity field in the ultrasonic measurement area. The influence of disturbance should be negated due to the flow meter channel used.
Keywords: CFD, fluid flow, disturbance, ultrasonic flow meter
Introduction
Ultrasonic (US) flow meters are devices for fluid flow measurement using the ultrasonic principle. This phenomenon is described by Doebelin [1]: The flow rate is related to the fluid velocity. When the pressure disturbances are propagated at the speed of sound and the fluid also has a velocity, then the absolute velocity of the pressure disturbance propagation is the algebraic sum of them. This effect may be used in several ways as an operating principle of an ultrasonic flow meter. The term ultrasonic means that the pressure disturbances are short bursts of sine waves at frequencies above the range audible to human hearing (above 20 kHz). The principle is illustrated in Figure 1.
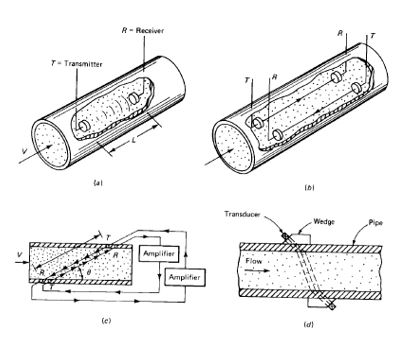
Figure 1: Ultrasonic measurement principle [1].
Flow disturbance tests: The flow disturbance test requirements for gas flow meters are described as a part of OIML R 137 [2]. Thus, specified different flow disturbances in front of the flowmeter to test the stability of measured values. The disturbances are different types of pipe elements. For a severe disturbance test, a half moon plate shall be added in some cases. The numerical simulation using the CFD (Computational Fluid Dynamics) methods is used in this article to verify the ultrasonic flow meter channel resistance to the flow disturbances. The main goal of this work is to evaluate and analyze numerically the flow field inside the ultrasonic measurement area.
Simulation Methods
CFD analyses have been performed using ANSYS Fluent 18.1 software [3]. The CAD model was prepared to the state of the discretized domain for the inner volume of the channel, i.e. the fluid volume only. Two various fluid domains were created representing the ultrasonic flow meter without disturbance as the first case. Then the disturbance labeled as d+ in OIML R 137 is placed in front of the flow meter. The innovated shape of the flowmeter body is currently the subject of a patent procedure and is therefore not presented in detail.
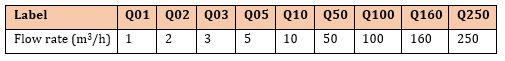
Computational setup: Following the problem definition, one inlet and one outlet face were defined. The rest of the boundary faces was set as walls. The inlet of the DN80 pipe is considered as the velocity-inlet, where the value of velocity corresponds to the flow rate values in Table 1. Pressure outlet boundary condition with zero pressure gauge is defined at the outlet faces. A gas with constant properties at 20°C, 3kPa pressure has been considered as the working medium. The viscous effects are taken into account using the k ε Realizable model with the EWT (Enhanced Wall Treatment) in the near wall region. The case is solved as a steady-state. The coupled solver is used. Pressure, velocity, and turbulence quantities are solved using second order spatial discretization schemes.
Table 1: Flow rate range – solved cases.
Velocity profiles evaluation: The distribution of velocity in measurement area is assessed based on the velocity profiles in several cross sections (see Figure 2, section 01 – section 08). In each cross section the line parallel to Y direction is created to evaluate the velocity profile. The values of z-component of velocity vector are obtained. Then for a comparison of results at different flow regimes, the dimensionless velocity Uz‘ [1] is calculated from:
where Uz (m/s) is the component of velocity vector in Z direction and the maximum value of the z-component of the velocity in each section is Uzmax (m/s).
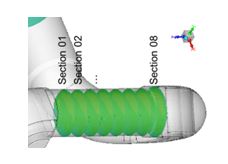
Figure 2: Results evaluation – Crosssection zones.
Results
Totally, 9 regimes of flow (different flow rates) have been studied for two various domains. The results show the profiles of dimensionless velocity Uz‘[1]. For different lines (means different sections) the values are shifted for better clarity in charts. The shift is for +0.5 for each line. Results on lines for section01 and section08 are not presented because they are not fully included in the expected measurement area. The velocity profiles for selected cases (Q02, Q10, and Q160) as representatives are shown in Figure 3-5.
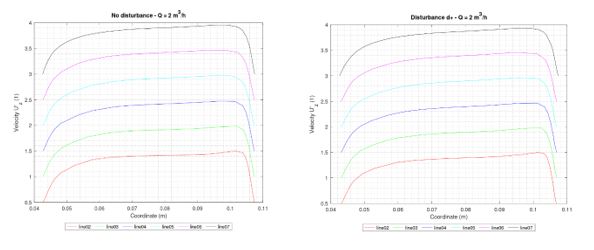
Figure 3: Velocity profiles – flow rate Q = 2 m3/h.
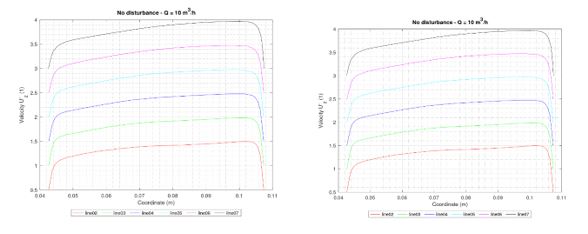
Figure 4: Velocity profiles – flow rate Q = 10 m3/h.
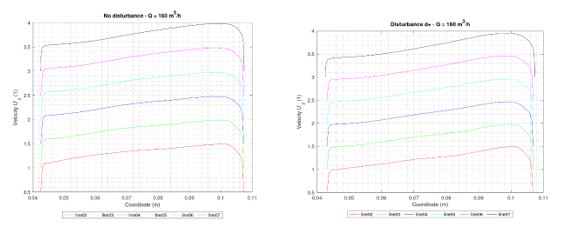
Figure 5: Velocity profiles – flow rate Q = 160 m3/h.
Conclusion
The aim of this study was the CFD analysis of the fluid flow field inside the ultrasonic gas meter. The numerical analysis for the sensibility on the disturbance included before the gas meter in the pipeline system was carried out. Boundary conditions of the model corresponded to the assignment. The methodology for results assessment was defined. The velocity profiles in the area for ultrasonic measurement have been obtained. Velocity profiles were investigated in the area that will be used for ultrasonic measurements. The evaluation of the profiles was aimed to confirm that the velocity field (profile) is flow independent. Furthermore, it was necessary to prove insensitivity to input disturbance. Based on the results, the profiles can be considered invariant when the flow rate changes. Comparison of both cases leads to the statement, that the disturbance does not affect the velocity field in the measurement area. In general, the analyzed design seems to be suitable for stabilizing the velocity field for ultrasonic measurements. The influence of disturbance should be negated due to the flow meter channel used.
Acknowledgment
Author gratefully acknowledges financial support by Czech Technological Agency under the project TACR FW02020048.
References
- Doebelin EO (1990) Measurement Systems: Application and Design: McGraw-Hill Inc.
- (2012) International organization of legal metrology. Gas meters. OIML R 137-1 & 2.
- Ansys Inc. Ansys Fluent User´s guide. Release R18.1.